Grafana Cloud Now Lets You Trace System Issues in One View

Ask any backend engineer about their last incident response and the story often sounds the same: ten open tabs, logs in one tool, metrics in another, and traces somewhere else entirely. Grafana Cloud is now tackling that problem head-on with a full-stack observability experience that connects the dots automatically.
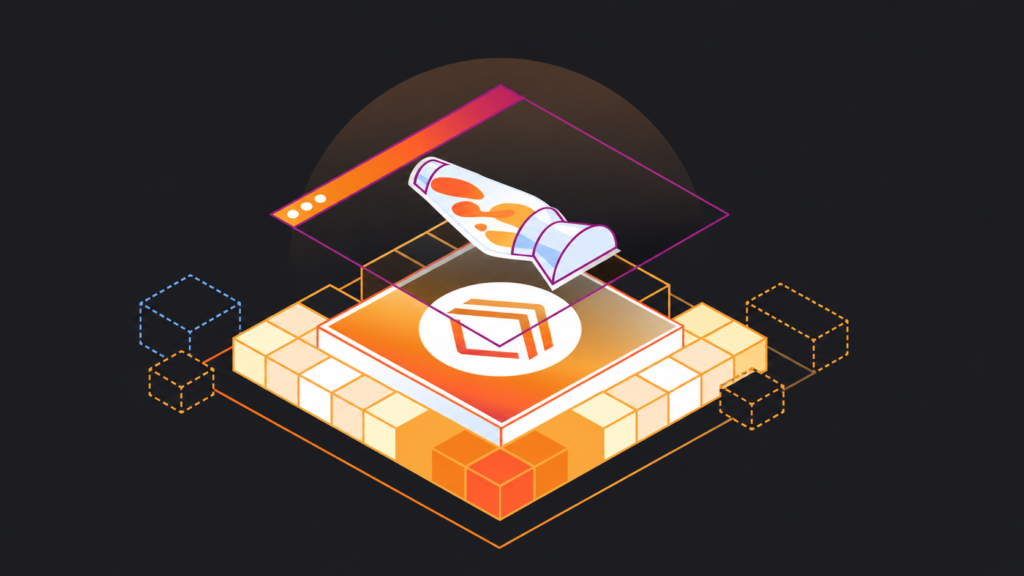
Grafana Cloud Application Observability and Kubernetes Monitoring now provide a full-stack view across applications, infrastructure, and Kubernetes environments. Instead of jumping between dashboards, engineers can start an investigation from a single service, pod, node, namespace, or cluster, and then drill down into the logs, traces, and profiles that explain what’s happening.
The engine powering all of this is the Grafana knowledge graph. It automatically models your applications and infrastructure into a unified graph, mapping telemetry to each connected entity, including services, pods, nodes, clusters, databases, and cloud accounts. The result is a single place to visualize relationships and observability data together, so teams move from symptom to root cause faster.
Three core features anchor the investigation workflow. The RCA Workbench brings insights, dependencies, and telemetry together in a single incident timeline. The Entity Graph gives a visual map of relationships between services and infrastructure components. The Entity Catalog acts as a central inventory combining health status, metrics, and metadata, so teams know what needs attention without hunting for it.
From any of these features, teams can launch directly into logs, traces, and profiles for a given entity via the embedded Grafana Drilldown tab, which opens with filters already derived from entity configurations.
To see this in action, consider a real-world scenario. An alert fires late in the evening. The on-call engineer follows the alert link directly to RCA Workbench. There, they explore connected entities, microservices, frontend components, and databases, without leaving the tool. A quick jump into the database’s logs reveals the root cause: the database has too many simultaneous connections and is refusing new ones, which is causing related services to break. Resolution options are then clear: scale resources or add more instances.
Teams can also customize how the knowledge graph filters and correlates their observability data. Default configurations cover common scenarios by mapping labels such as pod, namespace, and cluster, along with standard OpenTelemetry fields like service.name and service.namespace for logs. Beyond that, engineers can create configurations for specific environments, apply them to certain entity types, or define matchers based on entity properties. For teams managing multiple environments, a common setup among Nigerian fintechs and cloud-native startups, this flexibility ensures observability fits their actual stack, not a generic template.
When configurations conflict, a priority order determines which one takes precedence. If no configuration matches, an additional screen allows users to temporarily apply one without immediately adjusting settings.
Grafana also recommends using the Grafana Terraform provider to automate configuration creation and management at scale. Full documentation is available via Grafana’s knowledge graph docs and the telemetry correlation guide.
Grafana Cloud full-stack observability is available now. For engineering teams tired of losing critical minutes switching between tools during incidents, it’s a direct answer to one of the most persistent pain points in modern software operations. Sign up for free to get started.